Making performance problems easier to find.
Performance Insights gave developers function-level visibility into where their backend was spending time—so they could find the slow part without digging through everything else first.
Follow the signal
From “this is slow” to “start here.”
01 / THE PROBLEM
When a request is slow, where did the time go?
We could report the total runtime of an API request, query, or task. Individual functions were much harder to see across request history, so developers had to work backward from the overall runtime and debug the function stack themselves.
For a request with a lot going on, the path from “this is slow” to “this is the thing making it slow” had too much noise in between.
02 / THE IDEA
Profile what can actually teach you something.
My engineering manager loved profiling our own application and wanted to give Xano developers some of that same visibility. The technical direction was intentionally lightweight: collect profiling data in Redis for functions where performance could vary meaningfully, tracking total runtime and executions over time.
We didn’t need to profile everything. Simple utility functions weren’t especially interesting. The goal was to capture enough information around database operations, custom functions, tasks, and other variable workloads to point developers toward the places worth investigating.
He defined the technical direction and handed the feature to me to build full stack. My job was to turn that data into something useful.
03 / PRODUCTIZING THE DATA
Answer one simpler question: where should I look first?
Runtime statistics alone still left developers with a lot to interpret. I designed the interface around the next useful step.
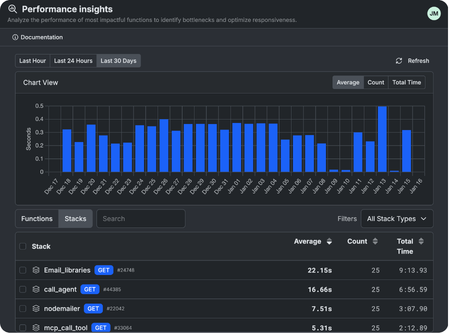
Functions were automatically sorted from least efficient to most efficient, so the biggest potential problems appeared at the top. From there, developers could compare total runtime, average runtime, total usage, and repeated function calls.
They could also filter and drill down by function type. If database operations looked suspicious, for example, they could narrow the view to database functions and investigate whether a query or index might be the culprit.
I turned profiling data into a place to start investigating.
04 / PUTTING IT IN CONTEXT
Useful information should show up where someone can act on it.
Performance Insights started as a dedicated experience, but it became useful enough that we kept finding better places to surface it. After launch, we brought the insights onto the main dashboard so performance information was visible much earlier in the development workflow.
Then we took it further. We added performance data directly to the function stack view. While building or debugging an API, developers could see when a particular function had been called repeatedly or was consistently taking longer than expected.
The progression
Original question: “What’s slow?”
Closer to the work: “What’s slow right here, while I’m working on it?”
THE RESULT
Make the slow part easier to see—and easier to fix.
I don’t have a neat conversion metric for this project. What I do have is the way the product evolved: from a standalone profiler into information surfaced across the dashboard and directly in the function-building workflow. For a developer tool, that felt like the right trajectory.